Real estate in Montreal: what are house prices like in 2025?
Montreal tends to attract a lot of attention in real estate news. Between the rising cost of living, property prices and comparisons with other major Canadian cities, Montreal is drawing as much interest from buyers as analysts. But what’s the situation in 2025? What are the real estate prices like in each neighbourhood? Using the most recent data from Centris, discover the average price of houses and condominiums by Montreal neighbourhood. While some neighbourhoods remain expensive, others continue to offer more affordable options.

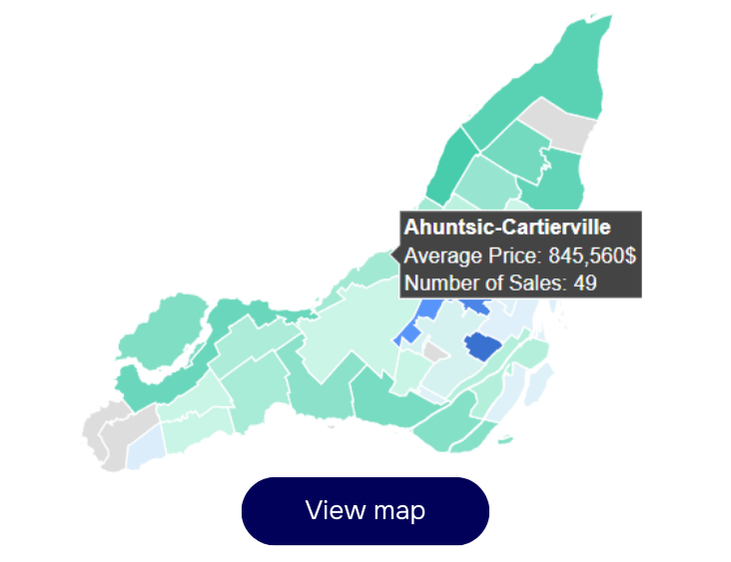
Interactive map of average Montreal house prices by neighbourhood
Click on the map and hover over it to see average home prices in each neighborhood on the island of Montreal.

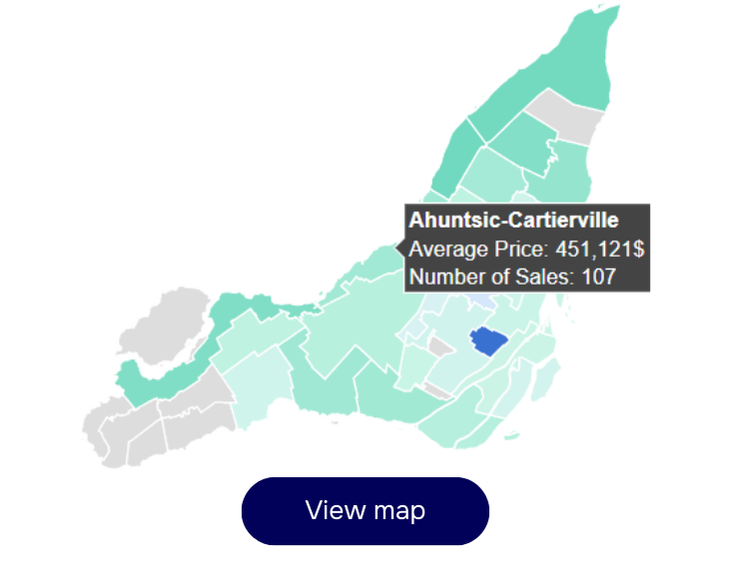
Interactive map of average Montreal condominium prices by neighbourhood
Click on the map and hover over it to see average condominium prices in each neighborhood on the Island of Montreal.

Q1 highlights for the Montreal market
- Average property price: The average price for all sectors is $952,991 for single-family homes and $544,197 for condominiums. Both categories are up 4% compared to the same period last year (Q1 2024).
- Number of sales: The increase in sales was mainly driven by condominiums, which grew by 20% compared to 7% for single-family homes.
- Days on market: The number of days on the market has dropped to 62 for single-family homes and 68 for condominiums.
- Volume of properties: The number of active listings (inventory) has increased by more than 9% over the past year (all residential).
Table showing changes to the average cost per neighbourhood in Montreal
|
|
||||
|
|
Single-family |
Condo |
||
| Sector | Average cost | Change | Average cost | Change |
| Ahuntsic-Cartierville | $845,560 | -6,60% | $451,121 | 8,40% |
| Anjou | - | - | $391,304 | 8,60% |
| Baie-d'Urfé | - | - | - | - |
| Beaconsfield | $985,532 | -1,20% | - | - |
| Côte-Saint-Luc | - | - | $535,844 | 2,90% |
| Côte-des-Neiges/Notre-Dame-de-Grâce | $1,239,486 | 6,30% | $625,987 | 16,60% |
| Dollard-des-Ormeaux | $883,157 | 13,70% | $512,166 | 16,80% |
| Dorval | - | - | - | - |
| Hampstead | - | - | - | - |
| Kirkland | $1,007,679 | 7,60% | - | - |
| L'Île-Bizard/Sainte-Geneviève | $715,587 | 14,30% | - | - |
| L'Île-Dorval | - | - | - | - |
| LaSalle | - | - | $492,963 | 1,50% |
| Lachine | $687,972 | 4,70% | $453,514 | 5,70% |
| Le Plateau-Mont-Royal | - | - | $605,386 | 0,30% |
| Le Sud-Ouest | - | - | $558,876 | -1,80% |
| Mercier/Hochelaga-Maisonneuve | $603,418 | -6,60% | $426,524 | 7,00% |
| Mont-Royal | $2,024,550 | 14,50% | - | - |
| Montréal-Est | - | - | - | - |
| Montréal-Nord | - | - | - | - |
| Montréal-Ouest | - | - | - | - |
| Outremont | - | - | $821,344 | -2,20% |
| Pierrefonds-Roxboro | $635,519 | 1,90% | $387,836 | 3,10% |
| Pointe-Claire | $865,853 | 8,90% | - | - |
| Rivière-des-Prairies/Pointe-aux-Trembles | $571,568 | 8,70% | $359,009 | 8,30% |
| Rosemont/La Petite-Patrie | - | - | $592,881 | 8,00% |
| Saint-Laurent | $1,024,594 | 3,50% | $497,805 | -4,70% |
| Saint-Léonard | - | - | - | - |
| Sainte-Anne-de-Bellevue | - | - | - | - |
| Senneville | - | - | - | - |
| Verdun/Île-des-Soeurs | - | - | $642,215 | -4,30% |
| Ville-Marie | - | - | $565,040 | 4,20% |
| Villeray/Saint-Michel/Parc-Extension | - | - | $510,085 | -1,30% |
| Westmount | - | - | - | - |
The most affordable neighbourhoods
Affordability remains a challenge for many future buyers. However, some areas of Montreal remain more affordable than others, offering more accessible real estate options for those looking to buy a home or condo without going over budget.
Rivière-des-Prairies–Pointe-aux-Trembles: a sector in high demand with buyers
Rivière-des-Prairies–Pointe-aux-Trembles is one of the most popular and affordable areas to buy a single-family home in Montreal. In Q1 2025, the average price climbed to $571,658, up 9% from the previous year, though still hovering around 40% below the Island of Montreal average.
There is growing interest in the area, which draws more than 11% of traffic for homes in Centris: views are up 9%, while the overall average has only increased by 3% over one year. The number of sales surged by 22%, consolidating its position as one of the most sought-after areas in the city. However, the condominium market remains quieter, accounting for only 5% of traffic and seeing a 5% drop in views, while the overall average for condos rose 4%.
Rivière-des-Prairies–Pointe-aux-Trembles stands out for its accessibility and steady growth, making it a great choice for families looking for a property. The area offers several parks, including the Parc de la Promenade-Bellerive and the Parc national des Îles-de-Boucherville, as well as direct access to the Rivière des Prairies, perfect for nature lovers. Residents also have access to an excellent public transit network, including the green metro line, making it easy to get downtown while enjoying a peaceful living environment.
Mercier–Hochelaga-Maisonneuve: a fast-changing and still affordable sector
In 2025, we are seeing an interesting trend with single-family homes: a 7% decline from the same period in 2024, bringing the average price to $603,418.
For condominiums, prices rose by 7% to an average of $426,524, putting Hochelaga below the island’s average of $544,197. The number of properties for sale is on the rise, giving buyers more choice and relieving some of the pressure. Hochelaga-Maisonneuve remains one of the most affordable areas among those directly served by the metro.
Mercier–Hochelaga-Maisonneuve stands out for its unique blend of urban dynamism and affordability. The borough comprises three districts: Hochelaga-Maisonneuve, Mercier-Est and Mercier-Ouest. It is known for its many green spaces, including the Parc Maisonneuve and the Montreal Botanical Garden, offering a perfect balance between nature and city life. Located close to the city centre, it is served by nine stations on the metro’s green line, making it easy to get around while maintaining a friendly neighbourhood atmosphere. Its cultural vitality and revitalization initiatives make it an attractive sector for families and young buyers.
Most unaffordable neighbourhoods
Unsurprisingly, Outremontremains one of the most inaccessible neighbourhoods for buyers. Its average price is significantly higher than the city average, making this area reserved for a select handful of wealthy buyers.
Outremont: a go-to destination for high-end condominiums
Outremont remains one of the most exclusive neighbourhoods to buy a condominium in Montreal. In Q1 2025, for example, the average price of a condominium was $821,344, down 2% from the previous year. Outremont is nearly one and a half times more expensive than the Montreal average.
The neighbourhood attracts a very select group of buyers, receiving only 2% of views for condominiums, a drop of over 10% in one year.
Outremont is home to several charming parks like Parc Outremont, Parc Beaubien and Parc Pratt, offering places to relax and activities for families. This neighbourhood is characterized by streets lined with mature trees and cozy single-family homes, with undeniable historical charm. There are also excellent, reputable private and public schools. The commercial arteries, including Laurier Ouest and Bernard Avenue, offer a variety of high-end boutiques, cafes and popular restaurants. In terms of public transit, Outremont is well served by the Outremont metro station (orange and blue lines) and several STM bus lines, making it easy to get to other parts of Montreal.
Mont-Royal: a sector still popular for single-family homes despite a drop in searches
Mont-Royal continues to be one of the most prestigious and expensive neighbourhoods on the Island of Montreal. In the first quarter of 2025, the average house price was $2,024,550, up 14% from the same period in 2024.
Despite this surge in prices, online interest in this sector is slowing slightly, drawing 3% of total traffic, down 1.5% over one year, a performance equivalent to the Montreal average.
Renowned for its peaceful residential environment, large single-family homes and green streets, Mont-Royal appeals to affluent buyers looking for an exclusive living environment close to downtown. The neighbourhood stands out for its reputable schools, sports facilities and exceptional quality of life, making it a safe bet for buyers with high purchasing power.
The most popular sectors
Which neighbourhoods have grown in popularity? Ville-Marie is definitely the big winner in this category! Interestingly, enthusiasm for this neighbourhood is also high among renters , making it one of the most popular—but also one of the most out-of-reach— neighbourhoods.
Ville-Marie: the urban hub for condo buyers
Ville-Marie is the most sought-after neighbourhood to buy a condo on the Island of Montreal, drawing 20% of total traffic. The sector is experiencing strong growth, with an 8% increase in traffic, 4% above the island average, confirming the growing appeal of this central neighbourhood. The average condo price rose to $565,040 in Q1 2025, up 4.2% from the previous year.
Known for its proximity to downtown and renowned cultural institutions like the Place des Arts, the Musée d’art contemporain de Montréal, the Bibliothèque et Archives nationales du Québec and the Théâtre du Nouveau Monde, Ville-Marie embodies the beating heart of Montreal. The vibrant neighbourhood appeals to young professionals and investors alike thanks to its economic dynamism, its variety of shops, restaurants and entertainment venues, and its excellent public transit network. A true crossroads between culture, business and leisure, Ville-Marie is an incomparable place to live for people who like being in the thick of the action.
| Tips and tricks Want to find out more about the communities in these neighbourhoods? Want to know the average age, household income, family composition, building age… and much more? Take a look at our Community profile section. |
Buying a property in Montreal
In 2025, Montreal is still a dynamic market where demand remains strong despite economic uncertainty. While prices continue to rise in central neighbourhoods like Outremont and Ville-Marie, other more peripheral areas like Rivière-des-Prairies and Mercier–Hochelaga-Maisonneuve still offer relatively affordable options.
Whether you’re looking to invest, buy your first home or move into a new neighbourhood, Montreal offers a wide variety of properties to meet every need. Start your search now and find your perfect house or condo in the city!
Methodology
This analysis of real estate prices in Montreal is based on comprehensive Centris data for the last 12 months and for Q1 2025, from January 1 to March 31. The average prices and price variations by neighbourhood were compared with prices from the same period in 2024 and with the previous 12 months. The overall data takes changes from the previous quarter and annual variations into account. These statistics, which are based on single-family homes and condominiums, were compiled and analyzed in collaboration with the Quebec Professional Association of Real Estate Brokers (QPAREB).
| Source: The map data presented in this article is taken from the dataset Limites administratives de l’agglomération de Montréal (arrondissements et villes liées) - Site web des données ouvertes de la Ville de Montréal on the City of Montreal’s open data site on April 1. With Administrative Breakdown data taken from the Ministère des Ressources naturelles et des Forêts (donneesquebec.ca) on April 1, 2025, under Creative Commons Licence 4.0.Copyright Notice - MIT Licence: Copyright (c) 2016–2024 Plotly Technologies Inc.: THE SOFTWARE IS PROVIDED “AS IS,” WITHOUT WARRANTY OF ANY KIND, EXPRESS OR IMPLIED, INCLUDING BUT NOT LIMITED TO WARRANTIES OF MERCHANTABILITY, FITNESS FOR A PARTICULAR PURPOSE AND NON-INFRINGEMENT. IN NO EVENT SHALL THE AUTHORS OR COPYRIGHT HOLDERS BE LIABLE FOR ANY CLAIM, DAMAGES OR OTHER LIABILITY, WHETHER IN AN ACTION OF CONTRACT, TORT OR OTHERWISE, ARISING FROM, OUT OF OR IN CONNECTION WITH THE SOFTWARE OR THE USE OR OTHER DEALINGS IN THE SOFTWARE. |
| The information provided in this article is for informational purposes only and does not constitute financial, legal, professional or other advice or opinions. As such, we make no warranties, express or implied, as to the accuracy, reliability, integrity or exhaustiveness of this information, which you use at your own risk. In no event shall Centris be held liable for actions made on the basis of the information contained in this article or for any damage or loss, direct or indirect, that may result from, or in connection with, the use thereof. We recommended consulting with industry professionals for personalized advice before making any decisions. |
See also:
A comprehensive 12-step guide to buying a home
Pre-Purchase Inspections: What You Should Know
Preparing for Your First Meeting With a Real Estate Broker
 The Largest Number of Homes for Sale


